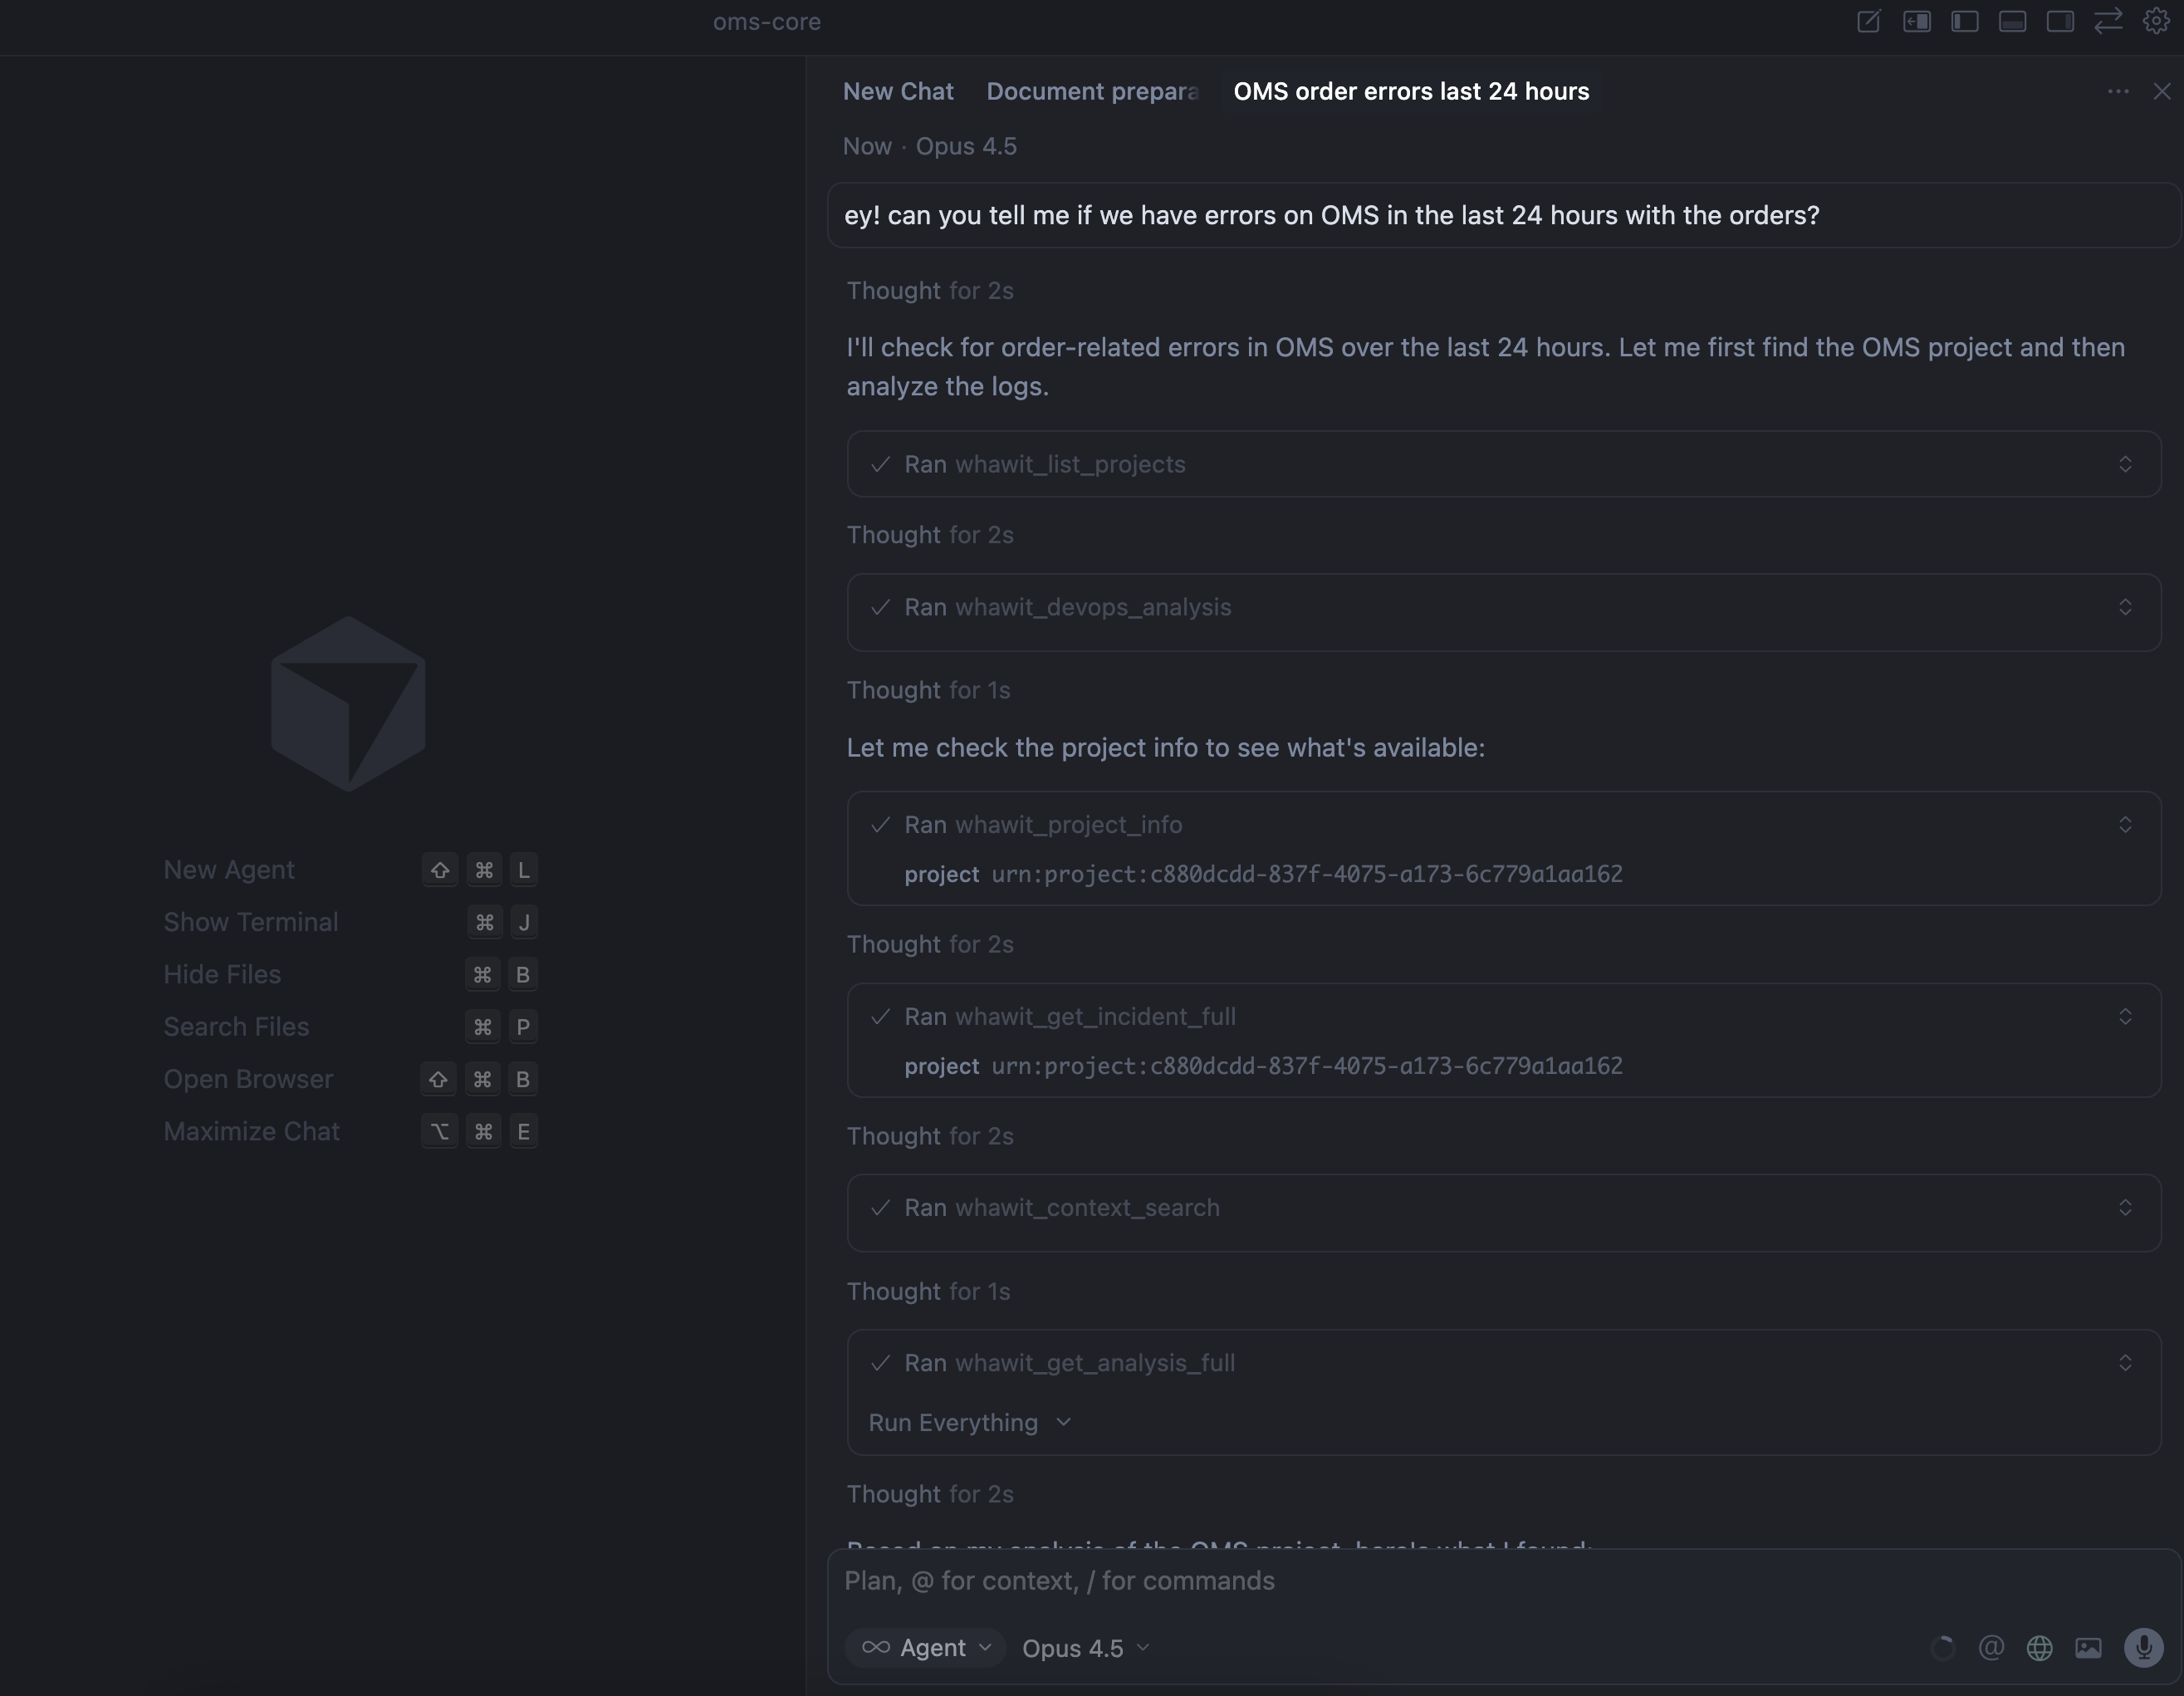
Debug incidents without leaving your IDE
Track incidents, view analysis summaries, and access your entire observability stack directly from VS Code. No more context switching between tools.
Also works with:


Everything you need, right in your editor
Stop jumping between dashboards. Get instant access to incidents, analysis, and integrations.
Projects Panel
Browse and switch between all your Whawit projects directly from VS Code. See project structure and quick access to resources.
Real-time Incidents
Track incidents by severity (High, Medium, Low) without leaving your editor. Get instant notifications when new issues arise.
Analysis History
Access your complete analysis history organized by date. Review past investigations and learnings from previous incidents.
Cloud Integrations
Direct integration with Google Cloud, AWS, and Azure. View logs from GCP Provider, Open Telemetry, and more.
Analysis Summaries
View detailed analysis summaries with focus areas, severity levels, and timestamps - all within your IDE.
Smart Notifications
Get notified about critical issues while staying focused on your code. Configurable alert preferences.
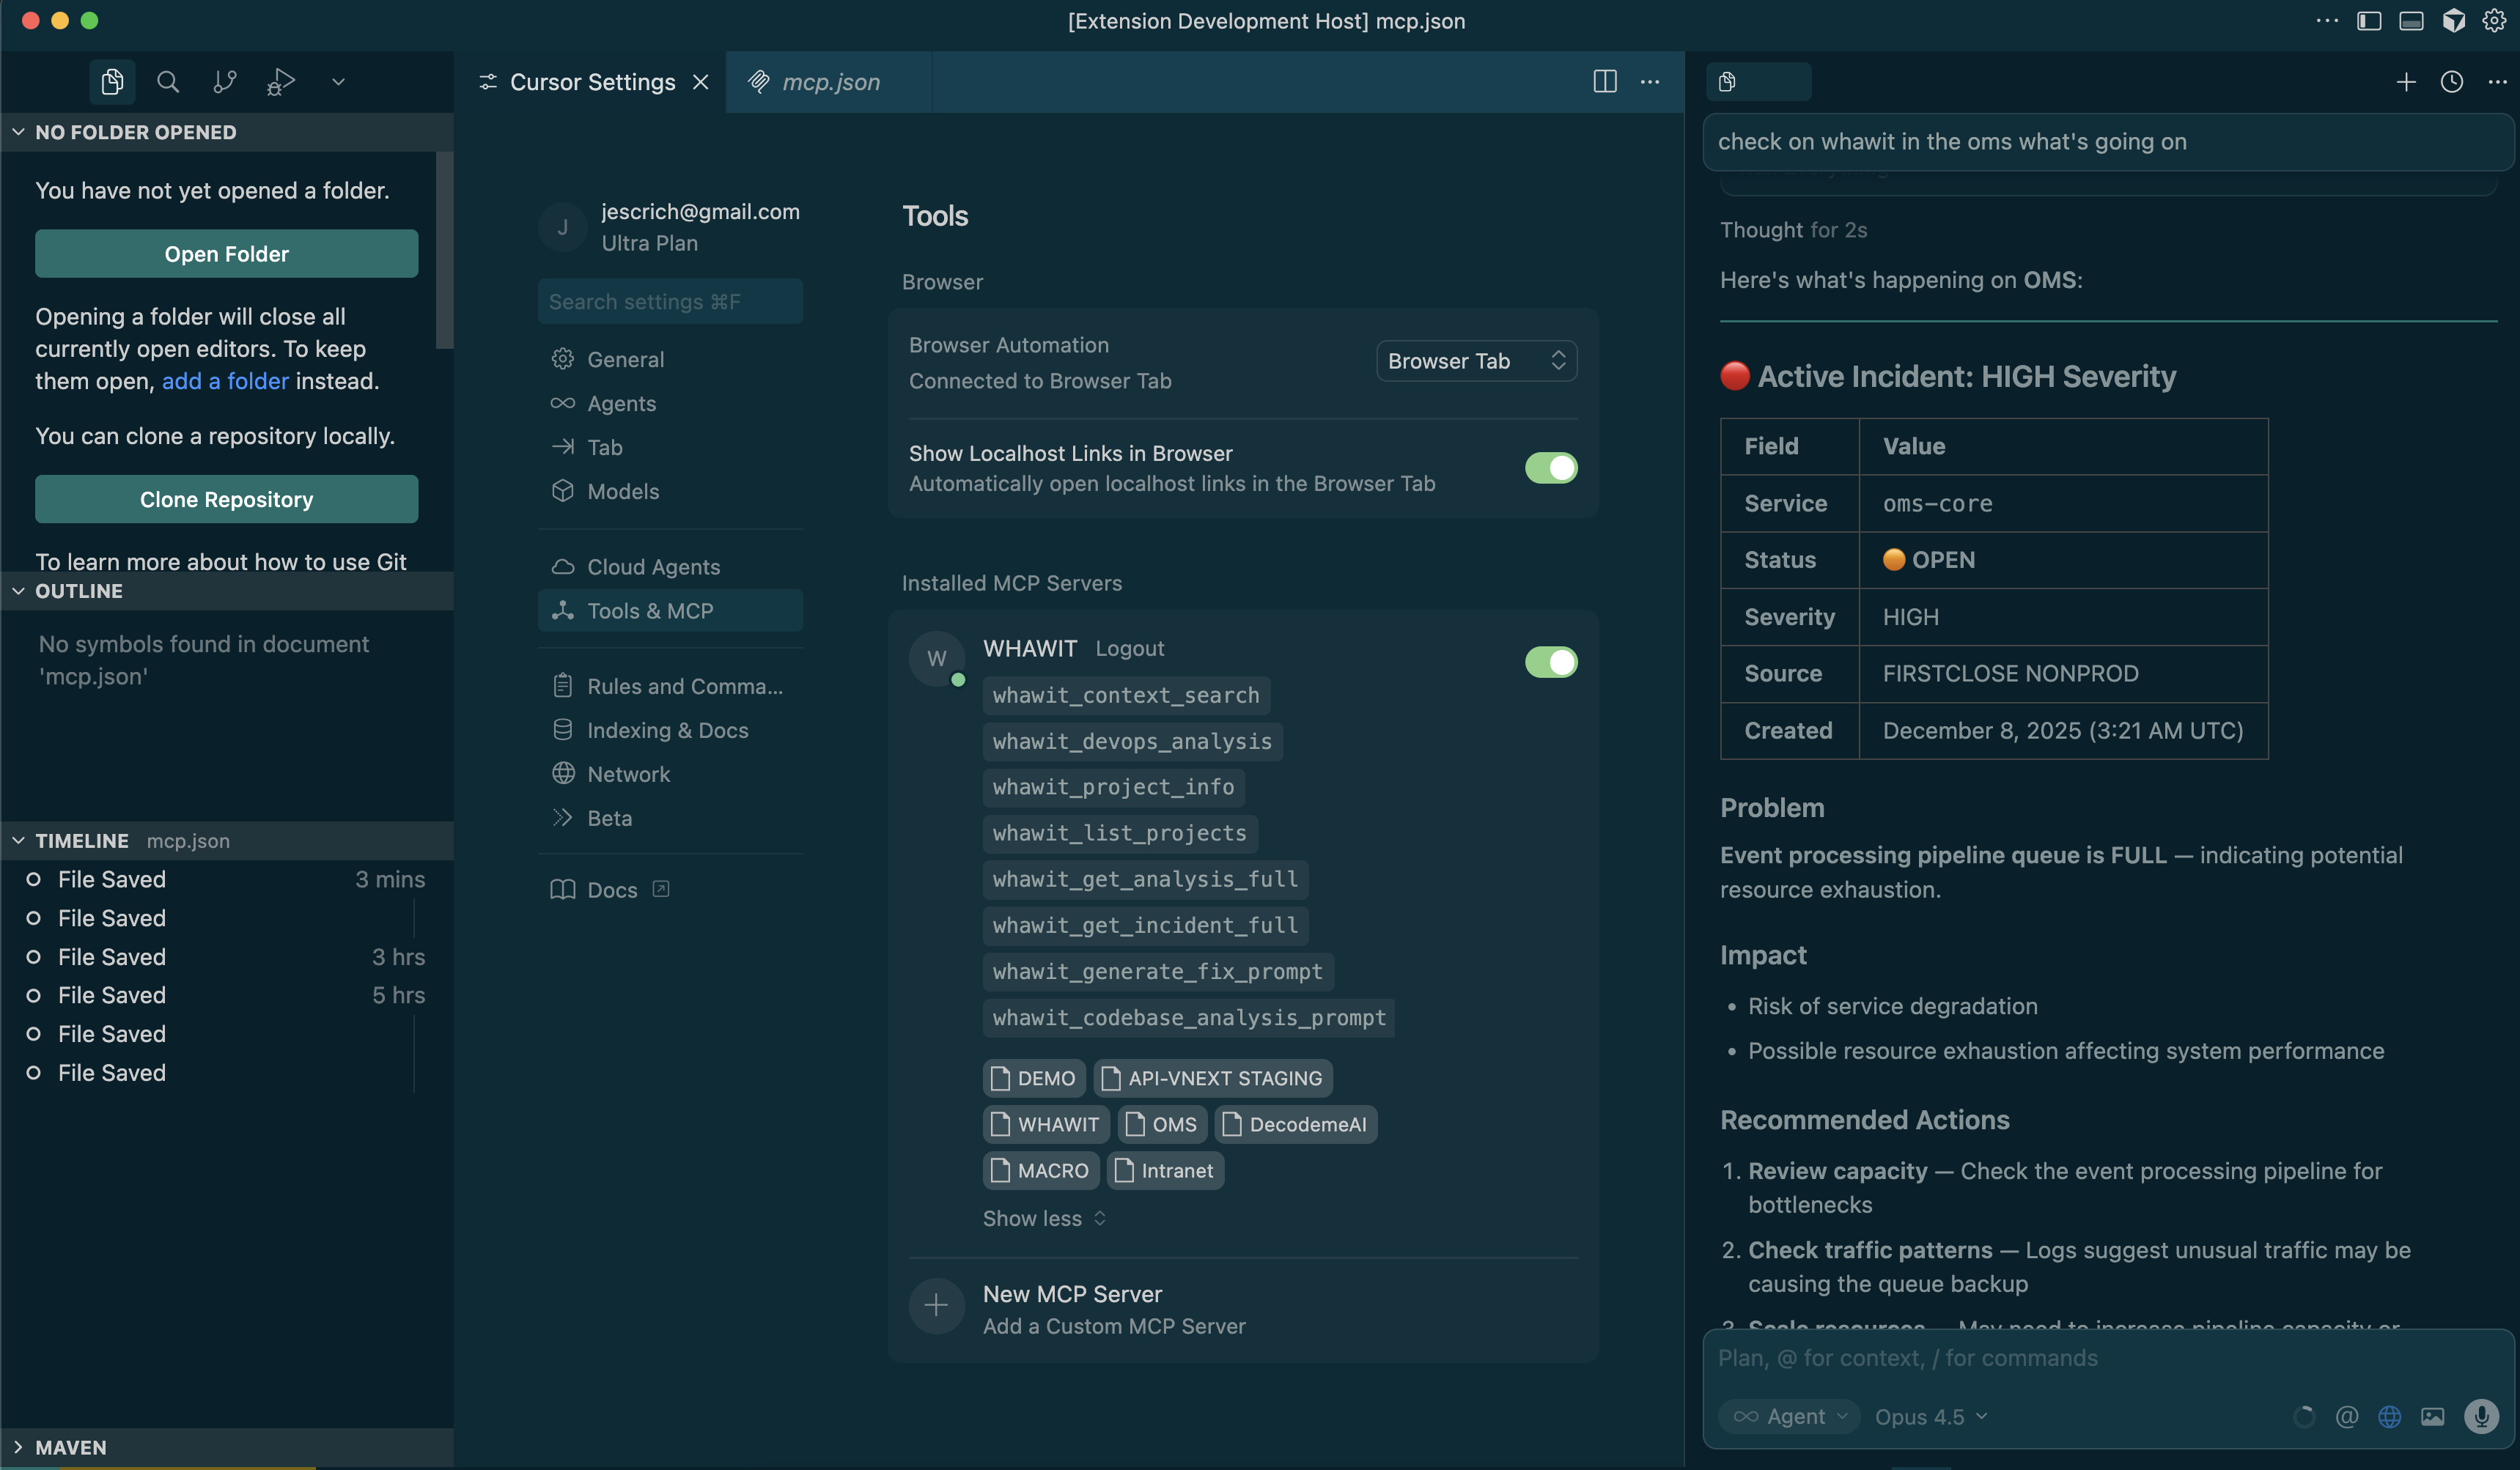
Detailed Analysis at Your Fingertips
View comprehensive analysis summaries with focus areas, affected services, severity classifications, and timestamps - all without leaving your code.
- Focus-driven analysis with clear problem identification
- Severity tags (HIGH, MEDIUM, LOW) for prioritization
- Direct links to cloud provider logs
- Timeline view of incident progression
See It in Action
Watch how to investigate a high-priority incident directly from VS Code
Ready to debug smarter?
Install the extension and connect your Whawit account in under 2 minutes.